DATA ANALYST ROADMAP

As technology advances and more businesses rely on data to make decisions, the demand for data analysts is skyrocketing. A data analyst’s role is to collect, organize, and interpret large sets of data to identify patterns, trends, and insights that can help organizations make informed decisions. If you want to pursue a career in data analysis, here’s a roadmap to help guide you through the process.
- Start with the basics:
Before diving into advanced data analysis techniques, it’s essential to have a solid foundation in math and statistics.
Statistics is the science of collecting, analyzing, and interpreting data. It’s a fundamental skill for data analysts because it provides the foundation for making sense of data. With a solid understanding of statistics, you can identify patterns, make predictions, and test hypotheses. Some of the essential statistical concepts to know include;
Descriptive statistics: Includes measures such as mean, median, mode, variance, and standard deviation that describe the properties of a data set.
- Inferential statistics: Includes techniques such as hypothesis testing, confidence intervals, and regression analysis that allow you to make predictions and draw conclusions about a population based on a sample of data.
- Probability: Includes concepts such as random variables, probability distributions, and Bayes’ theorem that allow you to quantify uncertainty and make predictions about future events.
Mathematics is also an essential skill for data analysts. It provides the language and tools needed to describe and manipulate data. Some of the essential mathematical concepts to know include:
- Linear algebra: This includes concepts such as vectors, matrices, and eigenvalues that are essential for working with large data sets and building machine learning models.
- Calculus: This includes concepts such as derivatives and integrals that are essential for understanding optimization algorithms and building predictive models.
- Discrete mathematics: Involves the concepts of combinatorics and graph theory that are essential for analyzing networks and building recommendation systems.

2. Tools of the Trade:
Microsoft Excel or Google Spreadsheet is one of the most popular spreadsheet programs in the world, and it’s a great tool for data analysis. With Excel, you can sort, filter, and manipulate large data sets, create charts and graphs, and perform basic statistical analyses. Excel is user-friendly and widely used, making it an excellent place to start for those who are new to data analysis.

SQL (Structured Query Language) is a programming language used to manage and manipulate relational databases. SQL allows you to extract, filter, and sort large amounts of data quickly and efficiently. It’s a crucial tool for data analysts who work with large databases and need to perform complex queries. SQL is also widely used, making it a valuable skill to have in the job market.

R is a programming language and software environment designed for statistical computing and graphics. It’s an excellent tool for data visualization, statistical analysis, and machine learning. R is widely used in academia and research, making it a valuable skill for those interested in these fields. R also has a large and active community, making it easy to find resources and support.
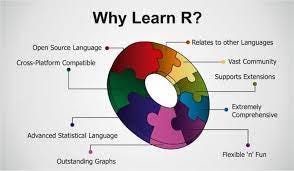
Tableau is a data visualization tool that allows you to create interactive dashboards, charts, and graphs. Tableau is user-friendly and can help you create compelling visualizations quickly and easily. It’s an excellent tool for communicating insights and findings to stakeholders, and it’s widely used in many industries.
Power BI is a business intelligence tool from Microsoft that allows you to connect to various data sources, transform and clean data, and create visualizations and dashboards. Power BI is an excellent tool for creating reports and sharing insights with stakeholders. It’s widely used in business and can help you make data-driven decisions.
Learning the tools of the trade is an essential step in starting a career in data analysis. Microsoft Excel, SQL, Python, Tableau, and Power BI are some of the most important tools to learn. Each tool has its strengths and weaknesses, so it’s essential to choose the tool that best suits your needs and the specific task you are trying to accomplish. With the right tools and some practice, you can become a skilled data analyst and start making data-driven decisions.
